
Published On Jun 15, 2018
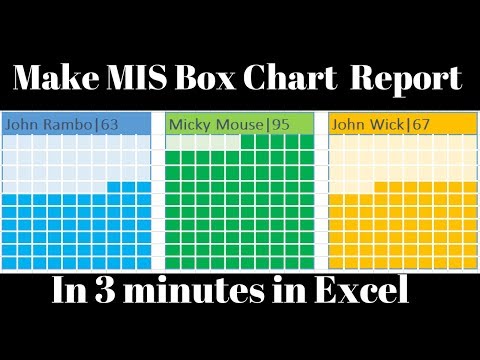
Make MIS Report Box Chart in Excel in just 3 minutes to show the results of anything in a report in excel. This Box chart excel report has been made using the conditional formatting.
MIS report stands for management information system. Business managers at all levels of an organization, from assistant managers to executives, rely on mis reports generated from these systems to help them evaluate their business' daily activities or problems that arise, make decisions, and track progress.
*Other Useful Excel Videos*
10 Most Used Formulas MS Excel
• 10 Most Used Formulas MS Excel
Learn Basic Excel Skills For Beginners || Part 1
• Learn Basic Excel Skills For Beginner...
10 Most Used Excel Formula
• 10 Most Used Excel Formula ☑️
*Most Imporant Excel Formuls Tutorials*
Learn Vlookup Formula For Beginners in Excel
• Learn Vlookup Formula For Beginners i...
5 Excel Questions Asked in Job Interviews
• 5 Excel Questions Asked in Job Interv...
Create Speedometer Chart In Excel
• Create Speedometer Chart In Excel
Learn the Basic of Excel for Beginners || Part 2
• Learn the Basic of Excel for Beginner...
Create Pareto Chart In Excel
• Create Pareto Chart In Excel
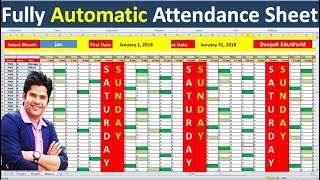
How to Create Dashboard in Excel
• How to Create Dashboard in Excel ☑️
Excel Interview Questions & Answers
• Excel Interview Questions & Answers ☑️
To watch more videos and download the files visit http://www.myelesson.org
To Buy The Full Excel Course visit . http://www.myelesson.org/product or call 9752003788
Connect with us on Facebook - / excelmadeasy
Connect with us on Twitter - / excelmadeasy