
Published On Dec 12, 2017
Near Acklins and Crooked Island
Bahamas
October1, 2015
This two-dimensional animation reconstructs the sequence of events leading to the sinking of the US-flagged cargo vessel SS El Faro in the Atlantic Ocean near Acklins and Crooked Island, Bahamas, which occurred on the morning of October 1, 2015.
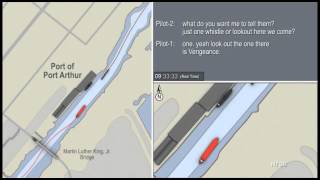
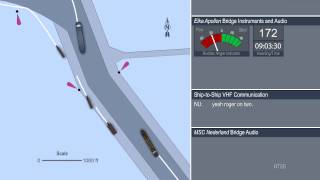
The animation displays the position of El Faro as a yellow circle, and a solid white line indicates the track path of the vessel. During the animation, the planned course and proposed course changes for El Faro are shown as dotted white lines.
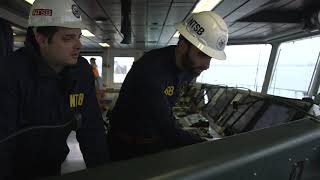
The Voyage Data Recorder (VDR) was recovered on August 8, 2016. The VDR retained the last 26 hours of conversation on the bridge and vessel operating data. Data from the VDR were used to determine the position and heading of the accident vessel. The bridge audio from the VDR was also used in reconstructing the sequence of events in the accident. The animation does not depict visibility conditions at the time of the accident. The animation includes audio narration, and the script of the narration is appended to this description/disclaimer.
The animation begins with an overall map of the area between Jacksonville, Florida and San Juan, Puerto Rico. An inset photograph of the fully loaded El Faro is shown in the upper right side of the screen, and the typical course from Jacksonville to San Juan traveling to the east of the Bahama Islands is depicted. An inset photograph shows the VDR in its position on El Faro before the voyage; the inset transitions to a photograph of the VDR in its location on the bottom of the ocean before it was recovered. An arrow indicating north, and a scale are shown in the lower left side of the screen.
The departure of the El Faro on September 29, 2015 at 9:48 pm Easter Daylight Time (EDT) is indicated, along with the position and development of Hurricane Joaquin from a tropical depression through a tropical storm to a hurricane. A series of predicted storm tracks are animated, indicating that the storm was consistently predicted to move
southwest, then turn north. The National Hurricane Center’s Best Track (the actual track calculated after the accident) is also shown.
The date and time in EDT of selected events are displayed on the lower left side of the screen, as they are depicted or when mentioned in the narration. The sequence of events starts at 5:36 am EDT on September 30 with the earliest information available from the VDR. The position of El Faro is shown along with the predicted storm tracks from Bon Voyage System (BVS) and from the National Hurricane Center Sat-C, plus the National Hurricane Center Best Track. The hurricane position is interpolated on the BVS or Sat-C tracks to indicate where the hurricane would have been expected to be at any time. The BVS information is shown in blue, the Sat-C information is shown in red and the National Hurricane Center Best Track is shown in black. Beginning at 2:30 pm EDT on September 30, the animation changes to a closer view including the islands in the Bahamas, with the islands of San Salvador, Rum Cay and Samana Cay identified with text labels. The Old Bahama Channel north of Cuba is also labeled with text.
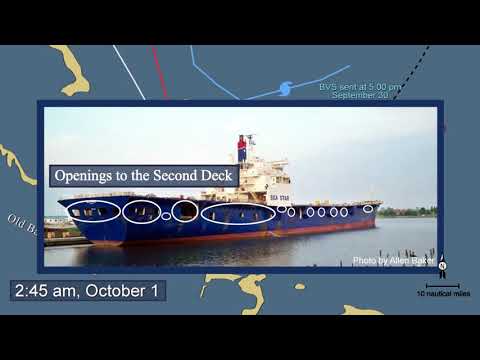
Beginning at 12:00 am EDT on October 1, the animation changes to a closer view centered on San Salvador, Rum Cay and Samana Cay, which are identified with text labels. The Old Bahama Channel north of Cuba is again labeled with text. An inset photograph looking at the aft and starboard side of El Faro is shown, superimposed with twelve white ovals to indicate the openings in the hull that would have allowed water to enter the second deck of the vessel.
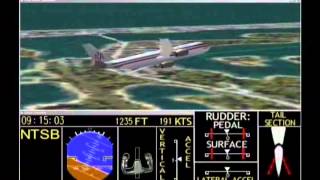
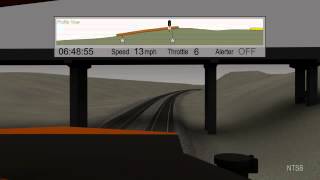
Beginning at 5:43 am EDT on October 1, the animation changes to closer view showing the position, heading and track path of El Faro, along with Samana Cay identified with a text label. The vessel is shown 30 times actual size. Selected summarized or paraphrased comments from the bridge audio from the VDR are displayed as text along with the time in EDT at the time they occurred. The center of the hurricane along the National Hurricane Center Best Track is shown, along with the wind circulation directions. An inset photograph illustrates a scuttle from El Faro. An inset graphic indicates the listing of the ship to starboard or to port, as reported in the narration.
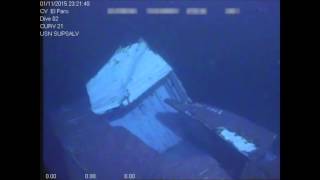
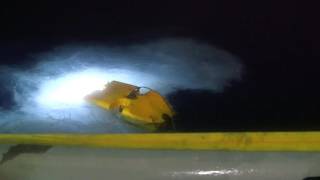
The animation is followed by an underwater photo of the stern of El Faro resting on the seafloor.